Using archaeological fieldwork and scientific data to support written statements

Site locations
Archaeological writing frequently draws upon information obtained through fieldwork. Such data are usually couched in specific terms and their appropriate use will differ between alternative forms of fieldwork or scientific analysis. Fieldwork data frequently incorporate a spatial component whilst scientific output may include tabular or statistical summaries. In all cases it is vital that the techniques are well understood in order to make appropriate use of the output results.
In these activities you will learn about incorporating fieldwork and scientific data in your written work, and consider when and how to include them.
Activity 1: Deciding whether or not to use fieldwork and scientific data
In this activity you are going to examine three archaeological arguments and consider whether the inclusion of fieldwork data in the form of a plan or a table could assist each of them.
Instruction
Consider each argument and select the tick symbol if you think including fieldwork data in the form of a plan or table would help clarify the argument or the cross symbol if you think it would not. Then read the feedback.
The development of the port infrastructure of Portus and Leptis Magna parallels the enhancement of their related inland transportation networks.
Should a plan or table be included?
The ceramic data from contexts 1205, 1605, 1709 and 2001 provides a clear indication that the Roman occupation was concentrated to the west of the Iron Age roundhouse.
Should a plan or table be included?
The poirier's facet, allen's fossa, trochanteric spicules and the development of the linea aspera on human femora WP34, WP45 and WP89 are all particularly pronounced, with WP89 having nearly twice the development of the fossa. There is a very steeply angled symmetrical notch present in the outer surface of the femoral head in all three cases and pronounced spicules on WP34 and WP45 unusual for the remainder of the sample from this cemetery.
Should a plan or table be included?
Activity 2: Considering where and how to present examples in your writing
If you have decided to use fieldwork data or plans to illustrate your general statements, you need to present them correctly. In the following activity you will decide whether or not some archaeology examples are correctly placed and presented.
Instruction
Open and study the 'Guidelines for including fieldwork plans' document below. Then determine whether or not the archaeology example is correctly placed and presented in each of the following extracts and select your answer. Then read the feedback.
Guidelines for including fieldwork plans (pdf, 8KB). You may wish to print this document.
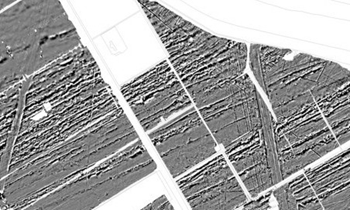
The magnetometry data indicates the underlying geology to the east of the site.
In the 2000 season of excavations there was very little Mamluk material (Table 1) relative to the 1999 and 2001 seasons. In 2001 the high proportion of Bast (Table 2) suggests that the excavated contexts were more industrial.
| Season | Cotton | Bast | Wool |
| 1999 | 350 | 572 | 103 |
| 2000 | 95 | 123 | 30 |
| 2001 | 133 | 672 | 56 |
Table 1: Mamluk textiles excavated at Quseir al-Qadim - Counts of fragments
| Season | Cotton | Bast | Wool |
| 1999 | 34.15% | 55.80% | 10.05% |
| 2000 | 38.31% | 49.60% | 12.10% |
| 2001 | 15.45% | 78.05% | 06.50% |
Table 2: Mamluk textiles excavated at Quseir al-Qadim - Percentage of fragments of each fibre type
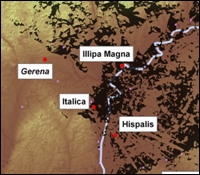
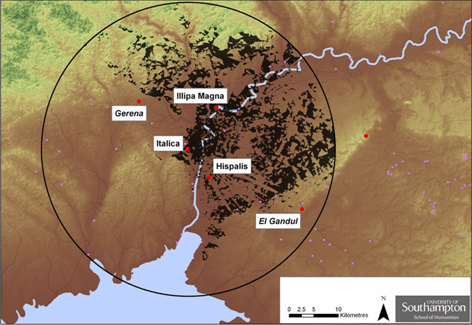
3. The topographic situation of Italica creates a clear distinction between its eastwards and westwards zones of visibility, as can be seen in the plan below (Figure 2.3)
Figure 2.3 Areas of high visibility (in black) with 30km radius of Italica; background shows modern topography (brown=low; green=high).
© eLanguages, Modern Languages and Linguistics, University of Southampton, 2015. All rights reserved.